|
|
Huntsville International Airport
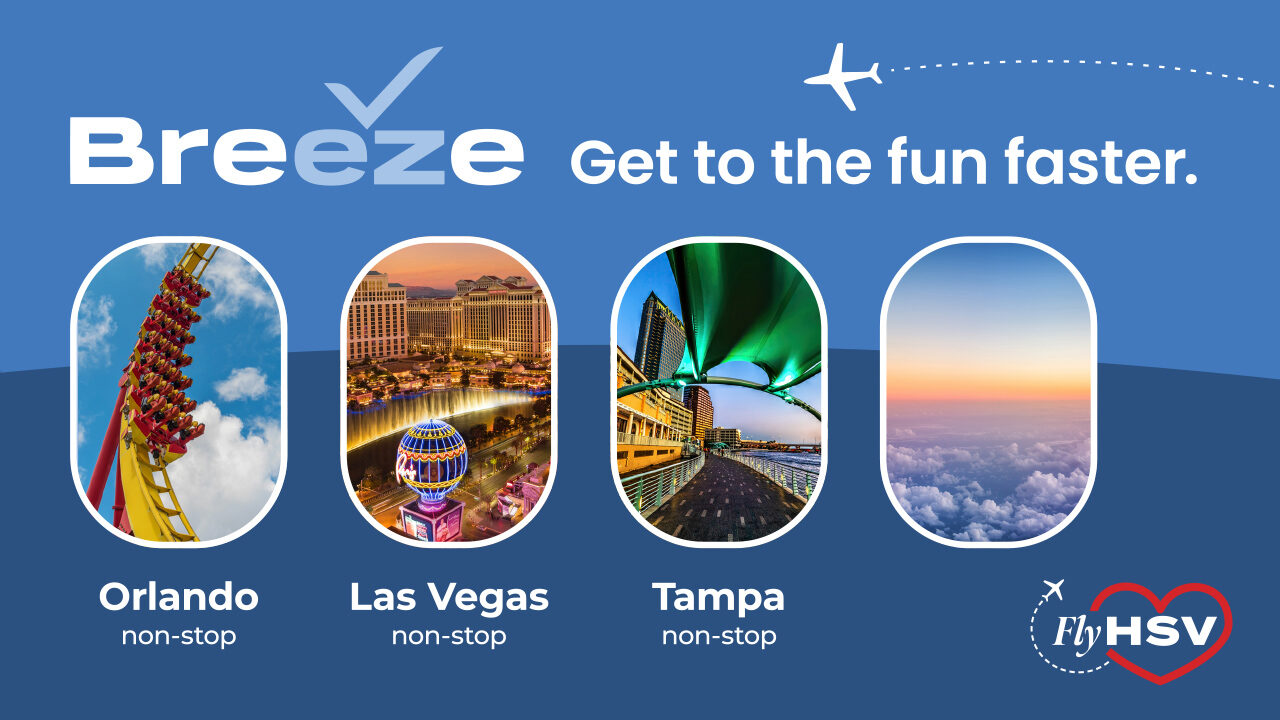
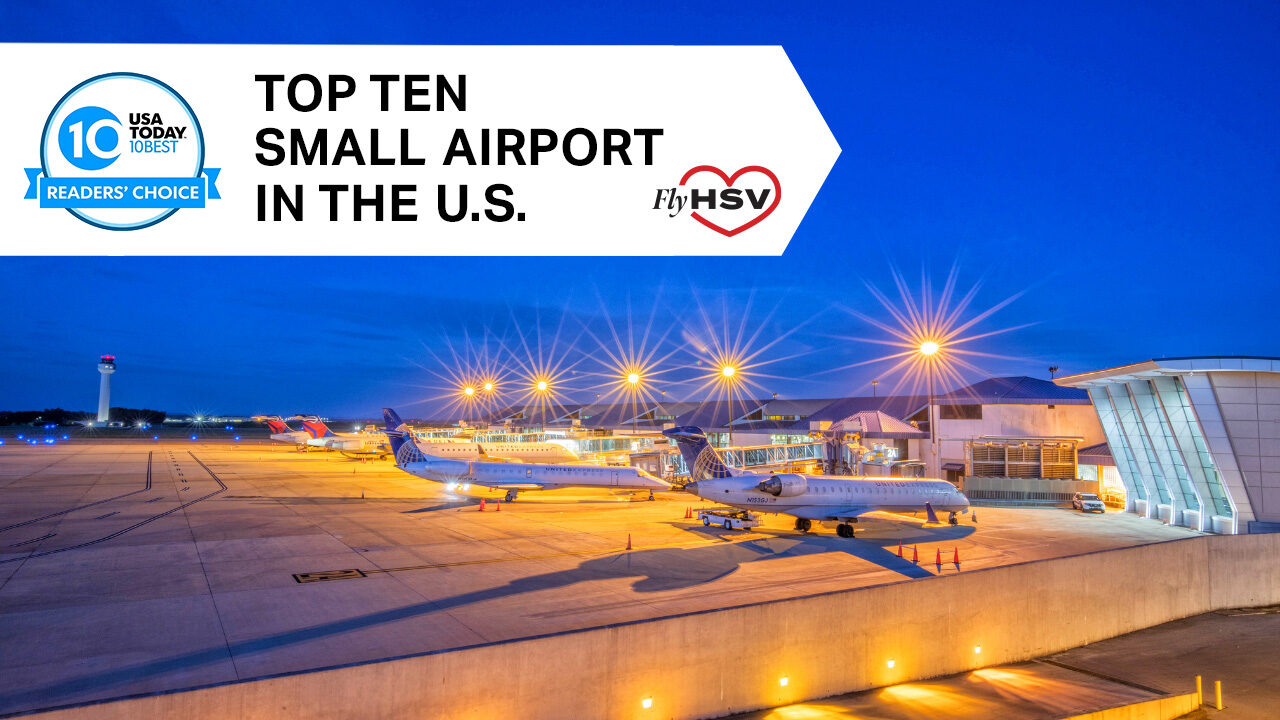
 Statistics
| Passenger Activity - Current Year to Date |
| Month |
Enplaned Passengers |
Deplaned Passengers |
Total |
Change from 2007 |
| Jan. |
46,599 |
48,537 |
95,136 |
12.2% |
| Feb. |
49,137 |
48,213 |
97,350 |
17.4% |
| Mar. |
|
|
|
|
| April |
|
|
|
|
| May |
|
|
|
|
| June |
|
|
|
|
| July |
|
|
|
|
| Aug. |
|
|
|
|
| Sept. |
|
|
|
|
| Oct. |
|
|
|
|
| Nov. |
|
|
|
|
| Dec. |
|
|
|
|
| YTD |
95,736 |
96,750 |
192,486 |
14.7% |
| Passenger Activity - Historic Information |
| Year |
Enplaned Passengers |
Deplaned Passengers |
Total |
% Change |
| 2007 |
621,743 |
618,070 |
1,239,813 |
7.3% |
| 2006 |
576,703 |
576,229 |
1,152,932 |
-8.9% |
| 2005 |
635,462 |
629,691 |
1,265,153 |
6.0% |
| 2004 |
599,781 |
599,589 |
1,193,370 |
13.5% |
| 2003 |
527261 |
524,383 |
1,051,644 |
6.3% |
| 2002 |
497,822 |
491,271 |
989,093 |
2.1% |
| 2001 |
487,511 |
481,443 |
968,954 |
-10.5% |
| 2000 |
543,898 |
538,451 |
1,082,349 |
3.0% |
| 1999 |
526,042 |
524,335 |
1,050,377 |
2.7% |
| 1998 |
507,198 |
509,604 |
1,016,802 |
13.0% |
| 1997 |
507,198 |
509,604 |
1,016,802 |
13.0% |
| 1996 |
450,734 |
449,100 |
899,834 |
5.3% |
| Top Twenty O & D Markets - Year Ended 09/07 |
| Markets |
Passengers |
| Washington, DC (National) |
102,519 |
| Orlando, FL |
45,977 |
| Dallas/Ft. Worth, TX |
38,108 |
| Los Angeles, CA |
37,065 |
| Baltimore, MD |
32,922 |
| Chicago, IL (O'Hare) |
30,100 |
| Denver, CO |
27,405 |
| Boston, MA |
27,051 |
| Houston, TX (Intc.) |
26,225 |
| New York, NY (LaGuardia) |
25,359 |
| Philadelphia, PA |
22,605 |
| Detroit, MI |
21,326 |
| Memphis, TN |
21,228 |
| Las Vegas, NV |
20,539 |
| Phoenix, AZ |
19,949 |
| Seattle, WA |
19,713 |
| Charlotte, NC |
18,749 |
| Ft. Lauderdale, FL |
18,277 |
| Washington, DC (Dulles) |
17,706 |
| San Diego, CA |
16,113 |
| SOURCE: APGDat |
|
|
|